Italian mutual funds manage over €1.3 trillion in assets, yet many Italians still subscribe to them without truly understanding how they work, what they really cost, or — the crucial point — why the vast majority fail to beat their own benchmark. The EU's MiFID II regulation made full cost transparency mandatory, and today a saver who understands the rules can choose instruments suited to their profile or, if they prefer, opt for passive alternatives such as ETFs. Here is what you need to know before signing the subscription form.
\n\nWhat a mutual fund is
\n\nA mutual fund is a collective investment pool made up of contributions from multiple investors and managed by an asset-management company (SGR, società di gestione del risparmio). The money is invested in stocks, bonds, money-market instruments or a combination of these, in line with the strategy set out in the fund prospectus. Each saver holds “units” of the fund, whose value fluctuates daily in line with the underlying assets.
\n\nThe legal structure guarantees that the fund's assets are segregated from those of the management company: even in the event of the manager's insolvency, investors' money remains intact. The depositary bank — a third party in the structure — physically holds the securities and monitors compliance with the rules. It is a three-actor system — manager, depositary, subscriber — designed specifically to limit the risks of mismanagement.
\n\nThe difference between open-ended and closed-ended funds
\n\nOpen-ended funds allow entry and exit at any time: units are subscribed and redeemed daily at the NAV (Net Asset Value) calculated at end of day. They are by far the most common type and include virtually all funds sold by Italian banks.
\n\nClosed-ended funds, on the other hand, have a limited subscription window: once it closes, no further investment is possible, and exit requires waiting until the fund matures or selling units on the secondary market where available. They typically cover real estate, private equity or specialist strategies. For retail savers, the choice almost always falls on open-ended funds.
\n\nThe main types of funds
\n\nFunds are classified by the asset classes they invest in. Knowing the categories helps you understand the expected risk and return.
\n\nEquity funds invest primarily in stocks. They can be broad (global equity) or focused (sector, geographic or index-specific). Volatility is high — they can gain 20% or lose 30% in a year — but over horizons of 10 or more years they have historically delivered the highest returns.
\n\nBond funds invest in government bonds and corporate bonds. Low volatility, more modest but more stable returns. Ideal for the defensive part of a portfolio. In 2026, with ECB rates falling after the 2024 peak, European government bond funds are delivering net returns of 2.5–3.5%.
\n\nBalanced funds blend equities and bonds in varying proportions (typically 30/70, 50/50 or 70/30). They are the classic “all-in-one” product sold by banks, designed for investors who do not want to build their own asset allocation.
\n\nMoney-market funds invest in very short-term instruments (3–12 month securities). Minimal returns but almost zero volatility. They are the fund equivalent of a savings account, useful as a parking place for liquidity.
\n\nFlexible funds have an unconstrained mandate: the manager can shift assets between equities, bonds, currencies or cash depending on their view of the markets. In theory this is maximum management freedom; in practice it often produces funds that follow the market without excelling in any phase.
\n\nWhat funds really cost: MiFID II transparency
\n\nThis is the most important topic for savers. Mutual funds carry costs that eat into a significant share of returns, and MiFID II has required complete cost transparency since 2018: each year the bank must send the client a detailed statement of how much they have paid in costs.
\n\nCosts break down into four main items. The subscription fee, a one-off charge on entry, can reach 4–5% on the most aggressive funds (thankfully it is declining: many funds no longer apply it). The management fee, deducted annually from the fund's assets, ranges from 0.5% for simpler bond funds to 2.5% for active equity funds. The performance fee, applied by some funds when they beat a benchmark, can add another 15–20% on excess returns. Finally, a redemption fee is generally zero but sometimes present in funds with minimum holding requirements.
\n\nA concrete example: €10,000 invested in a global equity fund with an annual management fee of 1.8%. Over 20 years, even assuming a gross annual return of 7%, you will have paid roughly €8,400 in cumulative fees. The final net capital will be around €27,500, against the €38,700 you would have had at zero cost. Every decimal point of fees matters, and over long horizons costs become the single biggest driver of final performance.
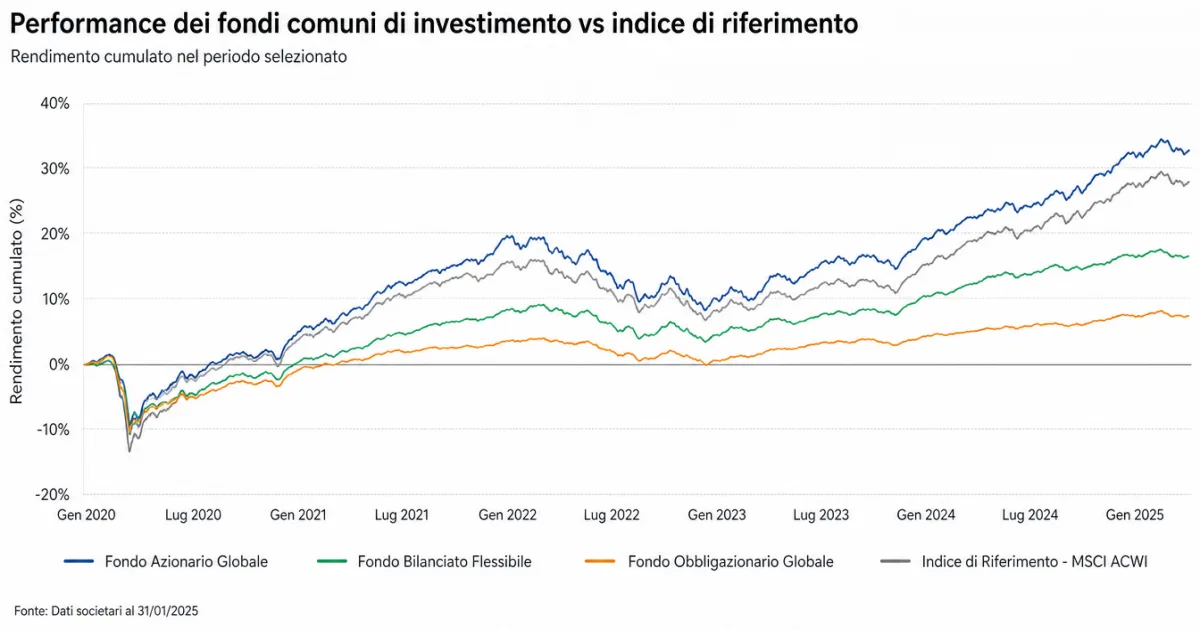
\n\nThe underperformance problem: what the data shows
\n\nThis is the point banks prefer not to emphasise when selling active funds. The SPIVA (S&P Indices Versus Active) report — S&P Dow Jones Indices' semi-annual study measuring active fund performance against benchmarks — tells an unambiguous story.
\n\nIn the SPIVA Europe Year-End 2024 report, 91% of global equity funds in euros underperformed their benchmark over 1 year — the worst figure in the history of the European reports. Over 10 years the picture is even starker: 93% of European equity funds and 79% of fixed-income funds fail to beat their benchmark. The problem is not cyclical: it is structural, and the data has been consistent for over twenty years of surveys.
\n\nEven more striking is the persistence figure: only 6.1% of European funds manage to stay in the top half of performers for five consecutive years. In other words, even a fund that beats the market one year will statistically have difficulty doing so the next. A positive active-fund return is almost statistically indistinguishable from luck.
\n\nThe cause is mathematical rather than ideological: the average costs of active funds (1.5–2% per year) are far higher than those of passive ETFs (0.1–0.3%). Over long horizons this gap compounds brutally, and to beat an index you first have to cover your own management cost. Very few managers achieve this on a sustained basis.
\n\nActive funds vs ETFs: the rational choice
\n\nETFs (Exchange Traded Funds) are exchange-listed funds that passively track an index — the S&P 500, MSCI World, FTSE MIB. They trade like stocks, have very low costs (TER between 0.07% and 0.30%) and charge no subscription or performance fees. For most Italian savers, they are the most rational choice.
\n\n| Feature | \nActive funds | \nPassive ETFs | \n
|---|---|---|
| Average annual management fee | \n1.5% – 2.5% | \n0.07% – 0.30% | \n
| Subscription fee | \n0% – 5% | \nBroker cost only | \n
| Performance vs benchmark over 10 years | \nBeaten in 79–93% of cases | \nTracks the index minus TER | \n
| Composition transparency | \nQuarterly | \nDaily | \n
| Trading | \nOnce a day (NAV) | \nReal-time like stocks | \n
| Minimum investment | \nOften €1,000–5,000 | \nOne unit (a few tens of euros) | \n
Our editorial view: for an average Italian investor, building a portfolio with two or three ETFs (global equity + European bonds + possibly emerging markets) is statistically the choice that maximises expected return at a given level of risk. For those who want to go deeper, our dedicated ETF guide covers how they work in detail.
\n\nWhen active funds make sense
\n\nActive funds are not always to be dismissed. There are niches where active management has shown above-average results: US small-caps (in the past two years, 70% of active funds beat the index), illiquid emerging markets, and some categories of high yield bonds. The logic is straightforward: where the index is less efficient, there is more room for active selection.
\n\nFor investors seeking exposure to sophisticated strategies (long-short, complex multi-asset, unlisted real estate), active funds also often remain the only practical route. In this context, however, one is talking about products for experienced investors, not for those taking their first steps in the markets.
\n\nHow to subscribe and manage a fund
\n\nA fund is subscribed through a bank, a financial advisor or an online platform. Before signing, the bank is legally required to profile the client using the MiFID questionnaire, which assesses financial knowledge, financial capacity and risk tolerance. Based on the profile, the bank proposes compatible funds.
\n\nOnce subscribed, the first units are allocated at the NAV of that day (or the following day, depending on the cut-off time). From that point it is possible to add capital through additional contributions (a lump-sum plan, PIC — Piano di Investimento di Capitale) or to set up a recurring investment plan (PAC, Piano di Accumulo del Capitale) with automatic monthly payments. The PAC is particularly suitable for beginners: it reduces the risk of investing at market peaks and builds long-term discipline.
\n\nRedemption is always possible (for open-ended funds) and typically takes 5–7 working days. Capital gains tax is 26% on actual profits at the point of redemption. Funds that invest predominantly in European government bonds benefit from a reduced 12.5% rate on the portion of returns attributable to those bonds. The depositary bank acts as withholding agent and remits the tax directly to the authorities.
\n\nCommon mistakes to avoid
\n\nThe first mistake is choosing a fund based solely on past returns. Past performance is not indicative of future results — a phrase written on every prospectus for good reason. Funds that have delivered the best returns over the previous three years tend not to repeat the feat in the following three, as demonstrated by the 6.1% persistence figure measured by SPIVA.
\n\nThe second mistake is ignoring the TER (Total Expense Ratio). This is the fund's total annual cost, including all recurring charges. A fund with a 2.2% TER must beat its index by 2.2% just to break even. An ETF with a 0.15% TER only needs to cover 0.15%. Over 20 years this difference translates into a performance gap of tens of thousands of euros on typical investment amounts.
\n\nThe third mistake is concentrating on a single fund or a single geographic area. The specific risk of one country or sector can be devastating: a Chinese equity fund in 2022 lost 25%, while global equity held its ground. Geographic and sector diversification remains the only genuine free lunch in finance.
\n\nWhat to expect in the years ahead
\n\nThe Italian fund market is going through a deep transformation. Banks are gradually replacing traditional funds with lower-cost products — index funds, “fund-ETFs”, zero-subscription-fee solutions. This is a direct result of European regulatory pressure (MiFID II, the Retail Investment Strategy) and the direct competition from ETFs, which in 2025 recorded net inflows across Europe.
\n\nThe long-term direction is clear: falling costs, growing transparency, products increasingly similar to ETFs even through traditional bank channels. For the Italian saver, this means more choice and fewer hidden costs — as long as you have the patience to compare actual conditions rather than accepting the first product the branch advisor recommends.
\n\nWhere to start
\n\nIf you already hold funds in your portfolio, it is worth doing a simple exercise: take your latest MiFID II annual statement, find the line “total costs incurred in the year” and divide it by the capital invested. That number — often between 1.5% and 3% — is what you are paying every year just to hold those funds. If it is above 1%, you have a statistically high probability of underperforming an equivalent passive ETF.
\n\nIf you are starting from scratch, the decision is even simpler. Open a recurring investment plan (PAC) in a global equity ETF, invest a fixed amount each month, and let time do the work. In 20 years you will have beaten 90% of active funds without ever needing to understand how they work. It is not glamorous — but the numbers are on your side.